Guide for the Geo smart meter display
Helpful information
Your electricity usage is measured by your electricity meter, and appears on your electricity bill in kilowatt hour (kWh) units. The appliances in your home use various amounts of energy. A typical kettle will be rated at about 2kW which means while in use it consumes 2kW of power per hour. If the kettle were to be used for a total time of one hour it would consume 2kWh or 2 units of electricity. Through switching the individual appliances on and off, your smart meter display will allow you to start to see how much individual appliances use as well as the cost of running them.
Useful tip
Why not start by turning off all appliances you can do without for a few minutes. This would include lights, TVs and digi boxes but not fridges or boilers. Then check your smart meter display to see how many kilowatts you’re using. This figure is your ‘base load’. Knowing your base load can help you see how much energy your appliances use; simply deduct it from the total number of kilowatts displayed. Overtime, you should gain a better understanding of your day-to-day energy use and can look for ways to reduce this by using energy more consciously.
Your smart meter display
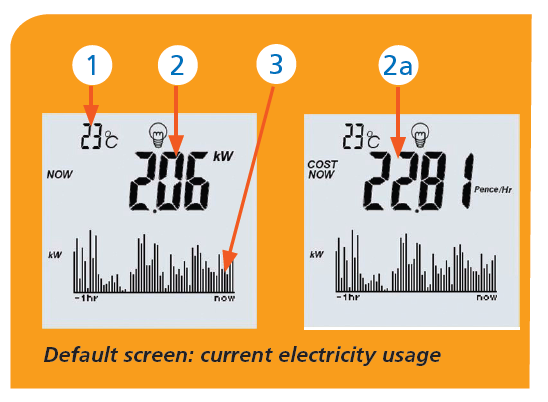
1. Time or temperature
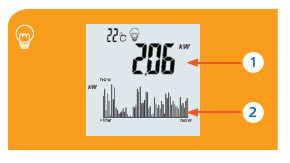
2. Current electricity usage in kW
2a. Cost per hour in either £/hr or pence/hr at the current rate of usage
3. Bar graph showing the last hour’s electricity usage in kW. Each bar represents one minute.
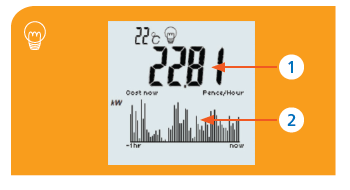
Readings and costs – electricity display example
The smart meter display will display energy costs over varying periods, together with meter readings. Press the Readings/Costs button to view this information.
The light bulb or gas flame at the top of the screen show which energy type the information displayed refers to. You can switch between electricity and gas (if applicable) using the top select button.
These images are for illustration purposes only.
A First press – Cost now
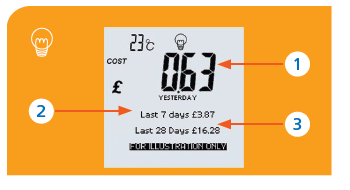
B Second press – Historical cost
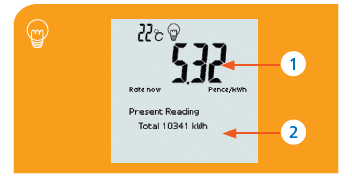
C Third press – Rate now
Readings and costs – gas display example
(Available only if a gas smart meter was fitted.)
The light bulb or gas flame at the top of the screen indicates which energy type you’re looking at. You can switch between the two using the top Select button.
These images are for illustration purposes only.
A First Press – Cost today
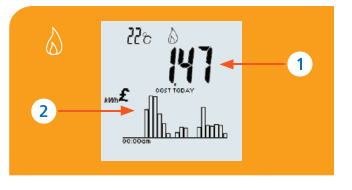
B Second Press – Historical cost
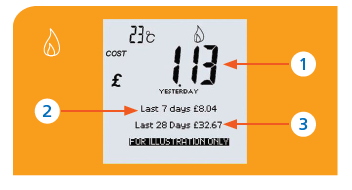
Historical costs for electricity usage for:
C Third pres – Current cost
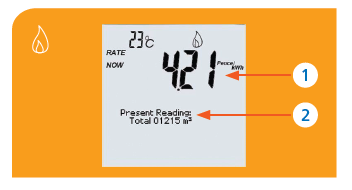
Current gas costs and actual meter readings.
Your current and past energy use
The smart meter display stores historic information on your energy usage that will help you to compare different time periods.(2) This additional information is displayed by pressing the usage button.
You can switch between gas(3) and electricity usage by pressing the select button.
These images are for illustration purposes only.
First press
Usage now
Second press
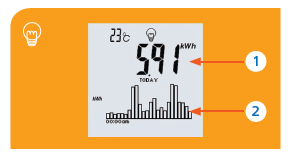
Energy used so far today
Note: This screen is available for both electricity and gas usage (where gas smart meter was fitted). Switch between the two by using the top select button
Third press
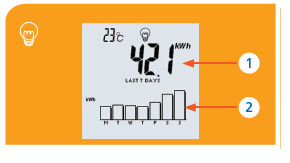
Energy used in last seven days
Note: This screen is available for both electricity and gas usage (where gas smart meter was fitted). Switch between the two by using the top select button
Fourth press
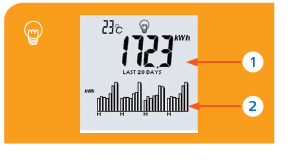
Energy used in the last 28 days
Note: This screen is available for both electricity and gas usage (where gas smart meter was fitted). Switch between the two by using the top select button
Fifth press
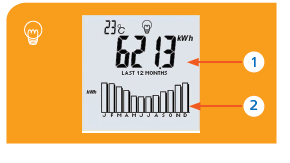
Energy used in last 12 months
Note: This screen is available for both electricity and gas usage (where gas smart meter was fitted). Switch between the two by using the top select button
You may use this information to help you identify what energy saving behaviours have been effective and also what events resulted in higher energy use over the different periods of time displayed.
The electricity screens will show any savings achieved by turning lights off when not needed, or taking appliances off standby. You may find the longer time periods shown on these screens particularly useful if you have taken energy-saving steps such as a change to energy saving light bulbs. In the same way, the information displayed on the gas screens should prove particularly useful for optimising the way your gas central heating is set to operate as it will reflect any savings made by turning room thermostats down by even a very small amount.
Carbon dioxide (CO2) emissions – your carbon footprint
The smart meter display shows the tree logo whenever the information on view represents CO2 emissions that may be attributed to your household’s energy usage. This information is accessed by pressing the tree button. You can switch between gas, (if applicable) electricity and total CO2 emissions for both gas and electricity by pressing the select button.
These images are for illustration purposes only.
Press button once: Current usage
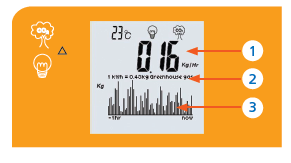
Current CO2 emissions caused by electricity usage.
Press button twice: Today’s usage
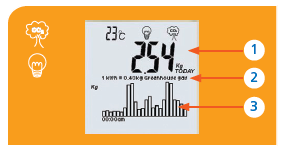
CO2 emissions caused by electricity usage today.
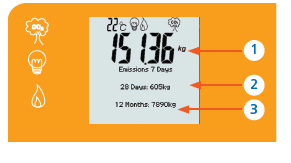
Press three times: Historical
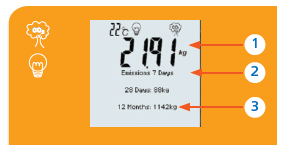
Historical CO2 emissions attributable to total energy usage (electricity and gas combined, where gas is available).
Note: This screen is available for both electricity and gas usage (where gas smart meter was fitted). Switch between the two by using the top select button.
Combined emissions
Today’s CO2 emissions for energy usage (electricity and gas combined, where gas is available).
Note: You can access this information by pressing the emissions button once and the select button to switch between electricity, gas and total combined household energy usage.
Where to put my smart meter display?
When selecting the best location for your smart meter display, please consider the following:
- The smart meter display is most useful when located in a high visibility and readily accessible area such as a kitchen or other common area. For your convenience the smart meter display can be mounted on the supplied worktop stand
- If the message ‘Cannot Talk To Meter’ is displayed by the smart meter display, please move it closer to the electricity/gas meter or to a more favourable location
- Do not install the smart meter display in bathrooms or any other locations with high humidity
- Do not install the smart meter display or power pack in direct sunlight
Energy consumption alarm function
The smart meter display allows you to set yourself targets and alarms to help monitor your consumption. You can set the alarm to alert you if, for example, you want to set yourself a target of using no more than £0.10 per hour. Once set, the alarm will let you know if you have reached this target. To do this, follow these instructions.
Open the clear cover to activate the alarm
- Press menu once - 1 Set Up will be highlighted
- Press enter once - 1 Buzzer Options will be highlighted
- Press enter again - Set Buzzer will be highlighted
- Press enter again - to highlight ON
- Use up and down arrow keys - to switch ON OFF
- Press enter once - to highlight Set Buzzer
- Press menu once - to exist to main menu
- Press menu again - to resume normal operations
Once the alarm is activated, you will need to set your usage target.
The menu option called ‘System info’ in the menu displays your meter serial number. This is for information only.
Turning your alarm off
- Pressing any button will temporarily turn off the alarm. The usage alarm remains set to alert you next time the alarm level is exceeded.
- You can change your usage alarm any time and as often as you wish.
- Setting the usage alarm to zero will disable it.
To set your consumption target
You can use your smart meter display to alert you if electricity costs per hour exceed an amount you specify. To enable this function:
- Press menu once - 1 Set Up will be highlighted
- Press down arrow key once - to highlight 3 Usage Alarm
- Press enter once - Set Alarm will be highlighted
- Press enter again - to highlight the alarm level (£0.00/Hour)
- Use up and down arrow keys - to enter desired value
- Press enter once - to display Set Alarm followed by set value. To set value, use the center and menu buttons to move left and right.
- Press menu once - to exit to main menu
- Press menu again - to resume normal operations
Health and safety precautions
Please take the following precautions to ensure the smart meter display functions correctly and is not damaged:
- Use only the power adapter supplied to you with this product. Always switch off power at the power outlet point before attaching or removing the power jack from the monitor
- If your smart meter display comes with a power adaptor manufactured by PHIHONG, you should not attempt to unclip the three pin part from the adaptor for any reason. If the adaptor does unclip, switch off the power at the socket before attaching it back. The smart meter display will power up and reconnect to your smart meter within a few minutes. If you experience any problems, call us on 0800 015 8787
- Do not use the smart meter display with a damaged power adaptor or lead. Call our dedicated customer service team who will arrange for a replacement pack to be sent to you
- Do not overload the power outlet by adding double adapters or by using multi-way sockets off one power outlet
- Do not expose the smart meter display to chemicals or any other liquids
- Clean the smart meter display using a soft dry cloth
- Do not open the monitor. There are no user serviceable parts inside; access by authorised personnel only
- Supervise young children if they use the smart meter display
- We will maintain your smart meter display for up to 12 months